Dimension area
Dimensions can be row dimensions, column dimensions, or slicer dimensions.
- Dimensions appear as dimension tiles.
- Dimension names are underlined. To open the Report contents page for a dimension, click on its name. (Dimension member names may also be underlined. Underlined member names represent groups. Clicking an underlined member name drills down into the group.)
- Dimension tiles have a textured area that can be dragged and dropped. You can arrange the dimensions any way you want, either by dragging and dropping their tiles or by using the Rearrange report dialog. (There must always be at least one dimension on the rows and one on the columns.) To open the Rearrange report dialog, do one of the following:
- Click Table options> Rearrange report.
- Select View menu> Table options> Rearrange report.
 Note: Dimensions for which member selections have been made can be removed from a report by clicking the X button for "Remove dimension and clear selections" in the Dimension list. However, there must always be at least one row and one column dimension in a report. Therefore if only two dimensions remain in a report they will not have X buttons.
Dimensions example
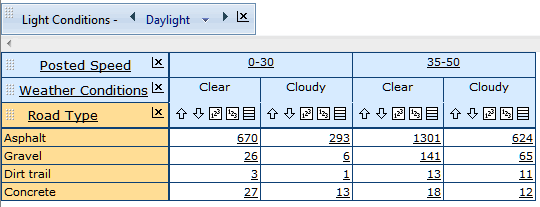
In the following screenshot:

- The slicer dimension area contains the Light Conditions dimension, whose active member is Daylight.
- The column dimensions and their dimension members are blue. They are as follows:
- Posted Speed - 0-30, 35-50
- Weather Conditions - Clear, Cloudy. (Weather Conditions is embedded inside Posted Speed.)
- The row dimension and its members are yellow.
- Road Type - Asphalt, Gravel, Dirt trail, Concrete.
Note: Regular (enlarged) charts do not have a dimension area. To customize the dimensions of an enlarged chart, you can do either of the following:
- View the chart as a table to arrange the dimensions, and then switch back to a chart view. To view the chart as a table, do one of the following:
- Click View as: Table on the toolbar.
- Select View menu> View as table.
- Use the Rearrange report dialog. To open the Rearrange report dialog, do one of the following:
- Click Table options / Chart options> Rearrange report.
- Select View menu> Table options / Chart options> Rearrange report.
|
![]() Note: Dimensions for which member selections have been made can be removed from a report by clicking the X button for "Remove dimension and clear selections" in the Dimension list. However, there must always be at least one row and one column dimension in a report. Therefore if only two dimensions remain in a report they will not have X buttons.
Note: Dimensions for which member selections have been made can be removed from a report by clicking the X button for "Remove dimension and clear selections" in the Dimension list. However, there must always be at least one row and one column dimension in a report. Therefore if only two dimensions remain in a report they will not have X buttons.