Data cells (Tables)
The data cells hold your report's data values. You can perform the following tasks in the data cells:
- View data values, footnotes, and missing values. Data cells may contain data values, or they may be empty.
- Drill through to the source records for a given value. See Drillthrough.
- Apply calculations to data values. Calculations insert extra rows or columns whose cells are a different color than ordinary data cells. See Calculate values.
- Apply coloured highlighting to specified data ranges. See Highlight values.
- Suppress display of empty rows or columns. See Suppress values.
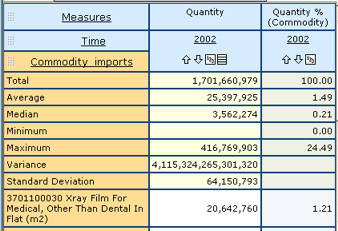
The following screenshot shows a table with a row dimension for which all the available calculations (Totals, Percentages, Average, Median, Minimum, Maximum, Variance, and Standard Deviation) have been selected. An extra row has been inserted for each calculation, and each data cell appears both as a value and as a percent.

- If a data cell contains footnotes, footnote indicators appear in brackets beside the data value. To display the text of the footnote in a popup, hover over the footnote indicator with your mouse cursor.
- If a data cell contains missing values, missing value indicators appear in the cell. Missing value indicators do not appear in brackets. To display the text of the missing value in a popup, hover over the missing value indicator with your mouse cursor.
Note: Missing values are not the same as zero values. The text of a missing value may explain why the value is missing.
Note: Cell-level annotations (footnotes and missing values) are not displayed when suppression is applied. See Suppress values.
- If a data value is underlined, it means that drillthrough records are available for the value. Click on an underlined value to display its drillthrough page.
Note: You can only drill through if drillthrough has been enabled by the OLAP cube administrator, and if the database where the source records reside is accessible. You cannot drill through calculated values.

