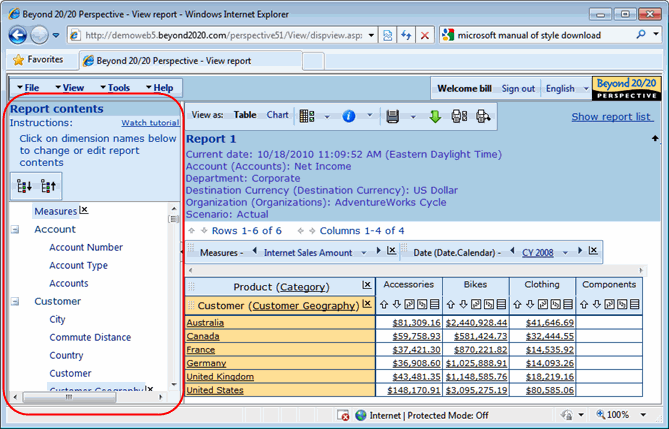
Dimension list (Report contents)

The Dimension list appears in a panel on the left-hand side of report pages (tables or charts), and on the member selection page. It shows all the dimensions in the data source.
Special dimension types are identified with unique icons, as follows:
 Suitable for banding. A band is a range of data values, such as ages from 18-30 or prices from $10 - $20. See Create custom bands.
 Time series. Time series sets enable you to display a time series dimension with various periodicities and rates of growth. See Create time series sets.
 Geographic dimension. Used with the optional mapping feature.
- Dimensions with no icon are ordinary dimensions. You can include them in a report as they are, or else use them to create custom groups. See Create custom groups.
You can resize or hide the Dimension list as follows:
- To resize the Dimension list, drag the window divider.
- To hide the Dimension list, click the textured area on the window divider.
- To show the Dimension list if it is hidden, click the textured area in the window divider on the left-hand side of the page.
Dimensions may be grouped into categories.

 Click the plus and minus signs to expand or collapse individual categories. (Plus and minus signs are only present if categories exist in the datasource.)
 - To expand or collapse all the categories at once, do one of the following:

 Click Expand all and Collapse all.
- Select View menu> Report contents> Expand all or View menu> Report contents> Collapse all.

