To open the Chart display settings dialog, do one of the following:
 Click Chart options and select Chart display settings.
- Select View menu> Chart options> Chart display settings.
To open the Chart display settings dialog, do one of the following:
|
Choose a chart type
To change the chart type, select a type and click OK.
Show slicer area in one line
If selected, all slicer dimension tiles display side by side in the slicer area. Scrolling may be required to see them all. Otherwise slicer dimensions stack as required to fit in the current window.
Show data labels
If selected, labels appear beside the data points in a chart.
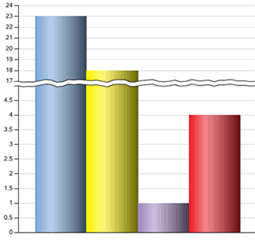
Scale break
If selected, scale breaking will be applied.