Row dimensions (Charts)
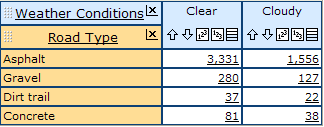
The row dimension tile appears underneath the "column" dimension tile in a table or a preview chart. The members of the row dimension appear on the row headers down the left-hand side of the data area. The row dimension members are the same color as the row dimension.
In this example, the row dimension is "Road Type." It is yellow in colour. It has four members: "Asphalt," "Gravel," Dirt trail," and "Concrete."

Any dimension can be placed in the row dimension area. You can have more than one row dimension by nesting one dimension inside another.
- You can move and nest dimensions in either of the following ways:
 Drag and Drop one dimension tile onto or next to another. Dimension tiles have a textured area for dragging.
- Use the Rearrange report dialog to arrange dimensions without dragging and dropping. (Click Table options> Rearrange report, or else select View menu> Table options> Rearrange report.)
- The name of the row dimension appears in the row dimension tile. Dimension names are underlined to indicate that they are clickable. Clicking a dimension name opens the Report contents page for the dimension.
- The names of the row dimension members appear in the row headers, down the left-hand side of the report area. If the name of a row dimension member is underlined, the member represents a group. To drill into the group and view its members, click on the underlined member name. (To drill back up, use your browser's Back button.)
 To remove a dimension from a report, click the X button in the top right-hand corner of its dimension tile.
Note: There must always be at least one row and one column dimension in a table. Therefore dimensions in a report that only has two dimensions will not have an X button.
 If a dimension or a dimension member has summary information associated with it, an "Info" icon appears after its name. You can click the icon to view the summary. See Information pages.
- (1,2) If a row dimension or dimension member has footnotes, footnote symbols appear in brackets after its name. You can hover over the footnote indicator with your mouse cursor to read the footnotes in a popup.
Note: If a report contains nested row dimensions, sorting (if applied) is performed separately on each innermost chunk of row dimensions. The initial chart page will show a separate preview chart for each chunk of data.

